By Tony Robertson.
Embed from Getty ImagesThe announcement of The Super League on April 18th rocked the footballing world to its very core. A closed shop league where the 15 founding members would be allowed to stay in perpetuity, saw European football fans unite almost universally against the project, which would have centralised wealth to the founding members and allowed only five teams the right to stay in the League without the threat of relegation.
While the war to prevent this ‘super league’ is far from over with Real Madrid President Florentino Perez insistent that it will go ahead, many of the clubs involved, most prominently the ‘big six’ English clubs have begun proceedings to pull, putting the idea on the back burner at least for now.
However, let us presume the clubs decided to carry on with their plans despite the backlash and UEFA were forced to make good on their threat that any player from a club involved in this league would not be allowed to represent their country at the Europeans Championships, then what would this mean for Gareth Southgate and the England National Team going into Euro 2020?
Well, that is the crux of this article.
This article will look at what England’s Euro 2020 squad would look like without players from clubs involved in The Super League and will use a base of statistics to pick the players from. This means there is no Harry Kane, no Phil Foden, no Dean Henderson, no Kieran Trippier, no Marcus Rashford, no Bukayo Saka, no Jordan Henderson, no Trent Alexander-Arnold among others. Although players on loan from big-six clubs will be treated as playing for the team they are on loan at. For example, Jesse Lingard, who is on loan from Manchester United, will be treated as a West Ham United player.
Embed from Getty ImagesThere will be a starting 11 fielded alongside a list of 26 players, as UEFA’s national team committee have recommended squad sizes be increased from 23 to 26.
The typical makeup of a team at a Euros or World Cup would consist of nine defenders, eight midfielders, three strikers and three goalkeepers. This typical set up will be kept to, but three more positions will be added depending on where the squad needs extra depth.
For each position, five metrics will be used to determine who should fill each position. Positions that perform identical or similar functions such as wide attackers, centre-backs and full-backs will use the same metrics, while centre midfield will use multiple sets of metrics to better balance the team.
To determine who makes the cut, this article will use a similar methodology to this article on the Premier League’s most creative player, whereby the position of the players used will determine how many points they will get per metric and will showcase the final table for each position. Five points will be awarded for the top-rated player, four for second three for third and so on.
To be eligible for selection, players must have played a minimum of 900 minutes of League football this season. Furthermore, we will presume all players in the list are fit and available for the coming Euro’s.
*All figures used are from FBref.com unless otherwise stated.
For the sake of this article, England will have a starting 11 which utilises a 4-3-3 formation with a defensive midfielder, a box-to-box midfielder and an attacking midfielder.
Goalkeeper:
To begin with, we will look at how many each English goalkeeper has conceded per 90 minutes.
Goals against per 90:
| Name | Goals against per 90 | Points |
| Nick Pope | 1.17 | 5 |
| Jordan Pickford | 1.27 | 4 |
| Aaron Ramsdale | 1.70 | 3 |
| Karl Darlow | 1.72 | 2 |
| Alex McCarthy | 1.92 | 1 |
Nick Pope is by far the best in the class in this regard with just 1.17 conceded per 90, and while his team might not be the best overall, they are renowned for their solid, tough to beat approach. Jordan Pickford takes the second spot with 1.27 per 90, which makes him the only keeper within 0.5 goals per 90 of Pope, with next best Aaron Ramsdale coming in third with 1.70 per 90, a significant drop.
Next, let’s look at how many saves they have made per 90.
Saves per 90
| Name | Saves per 90 | Points |
| Sam Johnstone | 4.13 | 5 |
| Aaron Ramsdale | 3.67 | 4 |
| Nick Pope | 3.60 | 3 |
| Karl Darlow | 3.24 | 2 |
| Jordan Pickford | 2.98 | 1 |
Sam Johnstone, who was sixth-best in the first category, makes a thunderous introduction to this article, sweeping in with 4.13 saves per 90, 0.47 better off than Ramsdale in second. This goes to show that Johnstone makes a lot of saves every game but still concedes a high amount. But is this down to his defence?
Post Shot Expected Goals minus goals allowed: (likelihood of goalie saving shot based on where the shot is going) positive numbers indicate better shot-stopping performance.
| Name | Post Shot Expected Goals minus goals allowed | Points |
| Nick Pope | 5.0 | 5 |
| Sam Johnstone | 3.9 | 4 |
| Aaron Ramsdale | 0.1 | 3 |
| Jordan Pickford | -0.7 | 2 |
| Karl Darlow | -4.0 | 1 |
Post Shot Expected Goals, measure how likely a shot is to go in after the direction of the shot has been determined, it is effectively the step beyond normal Expected Goals, and is used to help measure goalkeeper performance.
This article is using PSxG-GA to calculate the full extent of this. Where zero is a statistically average goalkeeper, a high positive number indicates a better ability to stop shots, whereas a negative number indicates a below-average shot-stopping ability.
Pope reclaims the top spot with a staggering score of 5.0. This means the Burnley stopper has prevented five more goals than an average keeper would be expected to. Next is Johnstone, which answers the question from the previous metric. Yes, it is his poor defence that is causing him to concede so many goals, as the West Brom stopper has prevented 3.9 more than he would be expected to.
Ramsdale is the only other keeper who is above average, even if he is only 0.1 above. Pickford is -0.7, meaning he is a bit below average, but he is still a far better stopper than Newcastle’s Karl Darlow, who is -4.0 while Alex McCarthy is even worse off than him showcasing that they are far below average goalkeepers.
Save percentage
| Name | Save % | Points |
| Nick Pope | 77.1 | 5 |
| Jordan Pickford | 71.8 | 4 |
| Sam Johnstone | 70.2 | 3 |
| Aaron Ramsdale | 69.4 | 2 |
| Karl Darlow | 66.7 | 1 |
Save percentage simply measures the percentage of shots a goalkeeper saves. As we can see, once again Pope is the cream of the crop, saving over 75% of the shots he faces. Pickford is next best with an impressive 71.8%, while Johnstone and Ramsdale are a close third and fourth with 70.2% and 69.4%
But what about distribution?
Long Pass completion %
| Name | Long pass completion % | Passes attempted (>30 yards) | Points |
| Jordan Pickford | 46.3 | 592 | 5 |
| Nick Pope | 44.1 | 760 | 4 |
| Sam Johnstone | 39.8 | 879 | 3 |
| Karl Darlow | 38.9 | 586 | 2 |
| Aaron Ramsdale | 36.6 | 781 | 1 |
In the modern game, sweeper keepers are a common site and attacks often start with the goalkeeper’s ability to distribute the ball effectively. Players such as Manuel Neuer or Ederson are prime examples of sweeper keepers who show extraordinary abilities to distribute the ball. But what about England keepers?
Pickford takes the top spot, with 46.3% of his passes 30 yards or more being completed. Nick Pope takes second with 44.1%. But it is important to note that he has attempted far more than Pickford has, perhaps showcasing the demands put on them by their respective club sides.
Overall:
Nick Pope takes top spot with 22 points, winning three categories and placing no lower than third in the others, cementing his place in the England team as the number one.
England’s second choice GK based on the metrics used is Jordan Pickford. The Everton stopper’s 16 points pip West Brom’s Sam Johnstone’s 15 points, meaning our third choice is Johnstone, who despite conceding a lot of goals, has shown he is a very good goalkeeper in a bad team.
Full backs/wingbacks:
The role of full-backs or wing-backs has grown massively in the last decade. Once a position played in by players who were either failed wingers or failed centre-backs, to paraphrase Jamie Carragher, the modern full-back is one of the most important positions on the pitch for many teams. You only have to look at Manchester City or Liverpool to see how important they can be. But who is the best among English full-backs?
To begin with, we’ll look at the most typical attacking attribute of a full-back; crossing.
Crossing
| Name | Crosses attempted | Completed crosses into the 18-yard box | Points |
| Matt Targett (LB) | 81 | 11 | 5 |
| Aaron Cresswell (LB) | 76 | 12 | 4 |
| Solly March (LB) | 71 | 13 | 3 |
| Luke Ayling (RB) | 67 | 12 | 2 |
| Matty Cash (RB) | 57 | 15 | 1 |
Matt Targett takes top spot with 81 attempted crosses. Fellow left-back Aaron Cresswell and Solly March take second and third with 76 and 71 crosses respectively. But what is interesting is that March has not played since the third of March, has the most completed crosses into the 18 yard-box of anyone in the table bar fifth-placed Matty Cash who has 15 from 57 attempted. Luke Ayling places above Cash for attempted crosses with 10 more than the Aston Villa man.
Expected assists per 90
| Name | Expected Assists per 90 | Actual assists per 90 | Points |
| Aaron Cresswell (LB) | 0.15 | 0.23 | 5 |
| Solly March (LB) | 0.09 | 0.05 | 4 |
| Matty Cash (RB) | 0.08 | 0.08 | 3 |
| Matt Targett (LB) | 0.08 | 0.03 | 2 |
| Luke Ayling (RB) | 0.08 | 0.00 | 1 |
What about overall creativity?
A crucial part of a modern full-backs game is about how creative they can be for their team in the attacking third, some even deem this to be more important than their defensive duties. So who is the best in class when it comes to creativity?
Cresswell once takes top spot, but it is important to note that he also takes set pieces for West Ham, which bolster his figures. We can also see that he is overachieving with how many assists he actually has. March, on the other hand, is underachieving in real assists by 0.04 per 90, creating the second most of any full-back.
Cash, Targett and Ayling all share the same value of 0.08 but are separated by Cash achieving what he is expected to in real terms, while the other two underachieve.
But now for defence.
Tackles Won per 90
| Name | Tackles Won per 90 | Points |
| Solly March (LB) | 1.88 | 5 |
| Luke Ayling (RB) | 1.68 | 4 |
| Matty Cash (RB) | 1.63 | 3 |
| Tyrick Mitchell (LB) | 1.62 | 2 |
| Kyle Walker-Peters (RB) | 1.60 | 1 |
March retains his position at the top of the class for tackles won per 90, which has him 0.2 clear of the next best player. Ayling and Cash are once again almost inseparable, duking it out for the right-back spot. Two new faces replace Targett and Cresswell, 21-year-old Tyrick Mitchell and 24-year-old Kyle Walker-Peters.
Tackles + interceptions per 90
| Name | Tackles + Interceptions p90 | Points |
| Tyrick Mitchell (LB) | 5.31 | 5 |
| Matty Cash (RB) | 4.81 | 4 |
| Kyle Walker-Peters (RB) | 4.51 | 3 |
| Luke Ayling (RB) | 4.45 | 2 |
| Jayden Bogle (RB) | 4.44 | 1 |
The two new faces storm up the table in defence, with Mitchell taking top spot with 5.31 tackles and interceptions per 90, showcasing some familiar defensive characteristics with another former Crystal Palace full-back. Walker-Peters is unable to dislodge Cash from the top three with his 4.81 per 90 enough for second over the Southampton player’s 4.51. Ayling is once again in the top five while Jayden Bogle makes his debut with 4.44 tackles and interceptions per 90.
However, one thing full-backs are asked to do more often than any other position is defend one on one against tricky and skilful wingers. So, who comes out on top of the pile in this regard?
Tackle’s success rate v dribblers
| Name | Successful tackles v dribblers % | Points |
| Ryan Bertrand (LB) | 58.3 | 5 |
| Tyrick Mitchell (LB) | 57.7 | 4 |
| Jayden Bogle (RB) | 56.7 | 3 |
| Matt Targett (LB) | 56.1 | 2 |
| Conor Townsend (LB) | 53.8 | 1 |
Two new faces and one returning one sees Ryan Bertrand and Conor Townsend sandwich the top five with 58.3% and 53.8% respectively. Mitchell and Bogle show their defensive class again by placing second and third with 57.7% and 56.7%, while Targett proves he isn’t all offense by coming in fourth with 56.1%.
Overall:
Picking two players from each position means four specialist full-backs can go.
At left-back, these options are Solly March and Tyrick Mitchell, with March being the number one by scoring one more point than his counterpart on the other side of the M23 derby. Matt Targett and Aaron Cresswell both score nine but are not fortunate enough to make the team.
Meanwhile, at right-back, Matty Cash outdoes his Leeds counterpart Luke Ayling by two points to take top spot. These two are far and away the best two right-backs out of the options available.
Centre backs:
Now moving on to the heart of defence; centre-back.
Much like the modern full-back, a modern centre back must now be composed on the ball and able to play out from the back while also having all the typical attributes of a good defender.
Tackles won per 90:
| Name | Tackles Won per 90 | Points |
| Chris Basham | 1.78 | 5 |
| Max Kilman | 1.44 | 4 |
| James Tarkowski | 1.13 | 3 |
| Jack Stephens | 1.07 | 2 |
| Ben Godfrey | 0.97 | 1 |
Our first metric sees a player from already relegated Sheffield United, take top spot, with the blades defence under a lot of pressure in most games, this is understandable, as Chris Basham takes a storming first place with 1.78. Wolves Max Kilman comes in second with 1.44 tackles won per 90, but he might not be considered as first choice by some.
The next ‘first-choice’ option in the list is James Tarkowski, with 1.13 tackles won per 90. Jack Stephens and Ben Godfrey make up the rest of the top five, with the latter being the only player on the list with less than 1.00 per 90.
Blocks per 90:
| Name | Blocks per 90 | Total blocks | Points |
| Ben Godfrey | 2.98 | 71 | 5 |
| Kyle Bartley | 2.53 | 60 | 4 |
| Jack Stephens | 2.23 | 27 | 3 |
| Tyrone Mings | 2.20 | 67 | 2 |
| Michael Keane | 2.20 | 62 | 1 |
However, Godfrey makes up for this by dominating the field in blocks per 90. Scoring a total of 2.98 per 90 with 71 in total. The next best is West Brom’s Kyle Bartley, who has a score of 2.53 per 90. Like Basham and Sheffield United, West Brom are a team who often come under defensive pressure for most matches, so again this is very understandable.
Southampton’s Stephens quietly scores in the top three, beating seasoned England internationals Tyrone Mings and Michael Keane, who have the same number of blocks per 90 minutes with 2.20 each.
Aerial duels won %:
| Name | Aerial duels won % | Points |
| James Tarkowski | 76.6 | 5 |
| Tyrone Mings | 75.6 | 4 |
| Michael Keane | 73.0 | 3 |
| Jamaal Lascelles | 72.6 | 2 |
| Tosin Adarabioyo | 70.6 | 1 |
Centre-backs are also expected to be aerially dominant. Tarkowski returns to the top five with a stunning 76.6%-win rate in aerial duels. The next best is the 6’ 5” Mings, who is the only other player with a win rate above 75%. Keane comes in at third with 73%, while the new faces of Jamaal Lascelles and Tosin Adarabioyo finish the top five with 72.6%- and 70.6%-win rates respectively.
Clearances per 90:
| Name | Clearances per 90 | Total clearances | Points |
| Ben Mee | 8.22 | 213 | 5 |
| Tosin Adarabioyo | 7.68 | 215 | 4 |
| Kyle Bartley | 7.34 | 174 | 3 |
| Tyrone Mings | 6.36 | 194 | 2 |
| James Tarkowski | 6.16 | 191 | 1 |
Ben Mee makes his first impression on clearances by having 8.22 per 90, more than 2.00 per 90 more than his CB partner Tarkowski, who rounds out the top five with 6.16. 23-year-old Adarabioyo secures second with 7.68 per 90, while Bartley and Mings take third and fourth.
But what about the aforementioned ability to play out from the back?
Pass completion %:
| Name | Pass completion % | Progressive distance (yards) per 90 | Points |
| Lewis Dunk | 89.7 | 368.4 | 5 |
| Michael Keane | 89.2 | 364.4 | 4 |
| Max Kilman | 87.7 | 290.9 | 3 |
| Conor Coady | 87.6 | 381.9 | 2 |
| Ezri Konsa | 86.6 | 160.7 | 1 |
According to this figure, Brighton’s Lewis Dunk is the pick of the bunch in terms of ability to play out, which is a feature of Brighton’s playing style. Dunk is also a very progressive passer, progressing the ball an average of 368.4 yards per 90 minutes. This progressive distance puts him behind only Conor Coady who progresses the ball 381.9 yards per 90 but falls 2.1% short in terms of accuracy.
Of the already capped CB’s Keane is the best option, with a pass completion of 89.2% and progression of 364.4 per 90. Kilman returns once again to take third spot, while Ezri Konsa comes in fifth with 86.6% completion. However, the Aston Villa man is the only player in the list to have a progressive passing score under 200 yards, marking him out as someone who plays short simple passes, rather than a long eye of the needle pass up to an attacker.
Overall
On Sky Sport’s ‘Monday Night Football’ Gary Neville spoke about how losing Harry Maguire would be a bigger problem for England than losing captain Harry Kane. But is there any truth to Neville’s hypothesis?
Well despite the loss of Maguire and John Stones, England seemingly have some decent options at CB.
The first choice based on the metrics used is none other than Burnley’s Tarkowski. Having been capped twice so far by England, he would be glad to know he would have the opportunity to represent his country again, as he scores points in three categories.
Mings and Keane are pretty much inseparable as the second choice, both scoring eight points, coming out second best in at least one category and both getting into the top five in three categories. The selection purely comes down to personal preference for either a left-footed CB or one who is very good on the ball.
However, the fourth and fifth choice CBs are surprising inclusions. Kyle Bartley and Max Kilman both score seven points, with elevates them above the likes of Ben Godfrey.
Centre Midfield:
Centre midfield is probably the trickiest position to rationalise with numbers. Some players are expected to be all-rounders, some are expected to be defensive colossi, while others are expected to be their team’s primary creator.
As such, for this position, 10 metrics that represent all aspects of the game will be used to choose the best overall players. Five total players will be chosen, but only two from a set area of the midfield. For example, there can only be a maximum of two defensive midfielders or attacking midfielders.
Tackles and interceptions per 90
| Name | Tackles and Interceptions per 90 | Points |
| Harrison Reed | 4.87 | 5 |
| Kalvin Phillips | 4.65 | 4 |
| Declan Rice | 4.59 | 3 |
| Isaac Hayden | 4.49 | 2 |
| Tom Davies | 4.23 | 1 |
Starting with a defensive metric, this a vital part of any team, as the defence needs support and cover from their midfield. Harrison Reed takes the top spot with 4.87 T+I per 90, with familiar names like Kalvin Phillips and Declan Rice making up the top three with 4.65 and 4.59 respectively, showcasing their defensive class.
Pass completion %
| Name | Pass completion % | Points |
| Harrison Reed | 86.2 | 5 |
| Declan Rice | 85.8 | 4 |
| Adam Lallana | 83.4 | 3 |
| Tom Davies | 83.4 fewer successful passes | 2 |
| Jude Bellingham | 83.0 | 1 |
While defensive output is important, a centre midfielders’ ability to keep the ball in play is very important. With that being said, pass completion percentage is an important metric for any midfield player. Reed once again takes top spot, with Rice going one better and placing second overall. Adam Lallana makes his way into the top five, equal with Everton’s Tom Davies. However, Davies had fewer successful passes than Lallana which sees the Brighton man take the position.
The first player from overseas now enters the list. Borussia Dortmund prodigy Jude Bellingham comes into the top five with an 83% pass completion rate. Quite impressive for a 17-year-old.
Progressive distance (yards) per 90
| Name | Progressive passing distance (yards) per 90 | Points |
| Ashley Westwood | 286.3 | 5 |
| Kalvin Phillips | 271.1 | 4 |
| Jonjo Shelvey | 270.7 | 3 |
| James Ward-Prowse | 257.2 | 2 |
| Ben Osborn | 242.2 | 1 |
But it’s all well and good being able to keep the ball, but passing side to side is not something England need. The true ability of a deep-lying midfielder is gauged by how good they are at progressing the ball up the pitch.
Burnley’s Ashley Westwood turns out to be good at this, with a total of 286.3 yards of progressive passing per 90 minutes. Phillips is the next best with 271.1 as he squeezes out Jonjo Shelvey who has 270.7 yards per 90. James Ward-Prowse, a man some only deem to be good at set-pieces, scores fourth here with a respectable 257.2 yards per 90.
Blocks per 90
| Name | Blocks per 90 | Points |
| Jake Livermore | 2.43 | 5 |
| Conor Gallagher | 2.29 | 4 |
| Kalvin Phillips | 2.20 | 3 |
| Jude Bellingham | 2.18 | 2 |
| Josh Brownhill | 2.01 | 1 |
Blocking shots is an important job for any defender, Jake Livermore takes the top spot here with 2.43 blocks per 90, while fellow West Brom player Conor Gallagher takes second with 2.29. Phillips pips Bellingham by just 0.02 to take third, while Burnley’s Josh Brownhill also makes his first appearance.
Ball recoveries per 90
| Name | Ball recoveries per 90 | Points |
| Josh Brownhill | 12.8 | 5 |
| James Ward-Prowse | 12.6 | 4 |
| Kalvin Phillips | 12.0 | 3 |
| Ashley Westwood | 11.1 | 2 |
| Jake Livermore | 10.4 | 1 |
Brownhill goes from fifth to first when we look at ball recoveries per 90. He squeezes out Ward-Prowse in first by just 0.2, while Phillips also makes another appearance.
Brownhill’s partner in crime Westwood also gets into the top five, showcasing the tenacity of the Burnley midfield.
Progressive distance of carries yards per 90
| Name | Progressive dribbling distance (yards) per 90 | Points |
| Jesse Lingard | 148.1 | 5 |
| Declan Rice | 131.0 | 4 |
| Ruben Loftus-Cheek | 122.9 | 3 |
| Ross Barkley | 111.8 | 2 |
| Jude Bellingham | 108.2 | 1 |
Similarly to passing, it is good to be able to dribble with the ball, but what use is it if the ball doesn’t end up progressing towards the goal?
Well Jesse Lingard, who is being counted as a West Ham player, seems to take this question to heart, blowing his compatriots out of the water in terms of dribbling ability, with 148.1 yards progressive carries per 90. Fellow West Ham midfielder Rice slots into second, being the only other player with more than 130 yards of progressive carries per 90.
Ruben Loftus-Cheek and Ross Barkley appear for the first time too, scoring 122.9 and 111.8 respectively, while Bellingham, continues to showcase his all-round ability.
Expected Assists per 90
| Name | Expected assists per 90 | Points |
| Ross Barkley | 0.23 | 5 |
| James Maddison | 0.22 | 4 |
| Jude Bellingham | 0.19 | 3 |
| Adam Lallana | 0.17 | 2 |
| Kalvin Phillips | 0.15 | 1 |
While we have looked at defensive output and ball retention, what about creating opportunities to score? Expected Assists measures the likelihood of a player getting an assist based on when they have passed the ball to a teammate who has then had a shot and whether or not that shot results in a goal.
Barkley edges out James Maddison in that regard with just 0.01 to separate them at the top. Bellingham comes in next with 0.19 xA90, while Brighton’s Lallana follows after him. Perhaps most surprising is the inclusion of Phillips, who has created 0.15 xA90, showcasing the Leeds man’s creativity from deep.
Key Passes per 90
| Name | Key Passes per 90 | Points |
| James Maddison | 2.36 | 5 |
| Ross Barkley | 2.34 | 4 |
| Adam Lallana | 1.64 | 3 |
| Jonjo Shelvey | 1.41 | 2 |
| James Ward-Prowse | 1.38 | 1 |
A more commonly used version of the xA metric is key passes, which measures how many times a player has played the pass before a shot has occurred without the shot ending in a goal.
Maddison and Barkley are once again top of the class with 2.36 and 2.34 key passes per 90. After a sizeable drop, Lallana is next with 1.64, before Shelvey and Ward-Prowse round out the top five.
Final third passes per 90
| Name | Final third passes per 90 | Points |
| Kalvin Phillips | 5.18 | 5 |
| Jonjo Shelvey | 5.15 | 4 |
| Ashley Westwood | 4.74 | 3 |
| James Ward-Prowse | 4.09 | 2 |
| James Maddison | 3.67 | 1 |
Another passing stat we can use to measure creativity is passes in the final third per 90. This simply tells us how many passes a player has made in the final third of the pitch.
Phillips and Shelvey are a cut above the rest when it comes to breaking the lines through passing, with both having over 5.10 final third passes per 90. Westwood is the next best in this regard at 4.74. There is then a drop of 0.65 between Westwood and Ward-Prowse before Maddison gets in with 3.67.
Shot creating actions per 90
| Name | Shot creating actions per 90 | Points |
| Ross Barkley | 4.70 | 5 |
| James Maddison | 4.58 | 4 |
| Adam Lallana | 2.67 | 3 |
| Ruben Loftus Cheek | 2.52 | 2 |
| Jonjo Shelvey | 2.45 | 1 |
Shot creating actions refer to any action which ultimately ends up leading to a shot on goal. This can be a pass in open play or a set-piece, a dribble, winning the ball back from via a pressing action, winning a foul which leads to a shot etcetera.
Once again Barkley and Maddison score highly creating 4.70 and 4.58 SCA per 90, while Lallana and Loftus-Cheek follow them up after a significant drop. Shelvey once again shows his ability to create from deep.
Overall:
Kalvin Phillips score the highest out of any midfielder with 20 points. Declan Rice is the next best DM. At the other end of the pitch, Barkley and Maddison are far and away the best-attacking midfielders, while Jonjo Shelvey has shown himself to be a bit of an all-rounder.
So while players like Lallana, Ward-Prowse or Bellingham miss out, England does have a strong core of central midfielders.
Wingers:
Now, what about our wide attackers?
This is another hotly contested position for England when everyone is fit. So does this competitiveness remain when the super league clubs are not involved?
First, let’s look at creativity.
Expected Assists per 90
| Name | xA90 | Points |
| Jack Grealish | 0.37 | 5 |
| Jadon Sancho | 0.29 | 4 |
| Marc Albrighton | 0.23 | 3 |
| Jack Harrison | 0.20 | 2 |
| Dwight McNeil | 0.19 | 1 |
Jack Grealish, proven in my previous article to be one of the most creative players in the league once again proves he is top of his class when it comes to creativity, amassing 0.37 xA90. The second player from the Bundesliga in this article Jadon Sancho gets within 0.08 of the Aston Villa man, but still ultimately can only get second.
In third is a man who was an unsung hero in Leicester City’s title-winning squad, Marc Albrighton. The man with a lethal cross puts homage to those words as he gets a decent score of 0.23 xA90, 0.03 better than the next best Jack Harrison. Burnley’s Dwight McNeil completes the top five with 0.19.
Expected Goals per 90
| Name | xG90 | Points |
| Jadon Sancho | 0.31 | 5 |
| Harvey Barnes | 0.29 | 4 |
| Jack Harrison | 0.23 | 3 |
| Jarrod Bowen | 0.22 | 2 |
| Jack Grealish | 0.19 | 1 |
Wide attackers are not just asked to contribute to goal creation though. They are also asked to directly contribute to goalscoring, and we will look at that here.
Sancho leads the class here, shortly followed by Harvey Barnes, who presuming he was still fit would certainly be in contention to go to the next Euro’s squad even with the super league clubs involved, as the Leicester winger scores 0.29 xG per 90.
Harrison appears for the second time, while West Ham’s Jarrod Bowen slots into fourth with 0.22 xG90, just 0.19 more than Grealish.
Dribble success rate %
| Name | Dribble success rate | Points |
| Jacob Murphy | 68.5 | 5 |
| Jack Grealish | 64.8 | 4 |
| Ademola Lookman | 63.9 | 3 |
| Eberechi Eze | 63.4 | 2 |
| Jarrod Bowen | 63.4 – fewer successful total | 1 |
Some players are not as good at passing as they are dribbling, but dribbling is still an effective way to create goalscoring opportunities.
Jacob Murphy from Newcastle showcases this, beating his man 68.5% of the time. Grealish, a renowned dribbler of the ball, gets himself into second place, while Ademola Lookman and Eberechi Eze make their first appearances, with the latter only beating Jarrod Bowen because he has more successful dribbles.
Progressive carries per 90
| Name | Progressive carries per 90 | Points |
| Jack Grealish | 12.5 | 5 |
| Jadon Sancho | 10.4 | 4 |
| Harvey Barnes | 8.24 | 3 |
| Ademola Lookman | 7.28 | 2 |
| Eberechi Eze | 6.72 | 1 |
As mentioned before, what use is the ability to dribble if a player does not progress up the field with it? Grealish and Sancho, showcase their deadly dribbling abilities through both having more than 10 progressive dribbles per 90.
Barnes, Lookman and Eze make up the rest of the top five.
Shot creating actions per 90
| Name | SCA90 | Points |
| Jack Grealish | 6.18 | 5 |
| Jadon Sancho | 5.32 | 4 |
| Ademola Lookman | 3.96 | 3 |
| Marc Albrighton | 3.67 | 2 |
| Jack Harrison | 3.23 | 1 |
There should be no surprises on who leads the way for shot-creating actions. Grealish and Sancho make up the top two again, these two are two of England’s best-attacking talents, and these figures have proved.
Overall:
If we presume we can only take three wingers as we have already taken five centre midfielders, then the first two who would be on the plane are surprise surprise, Jack Grealish and Jadon Sancho. They have dominated the field, scoring 20 and 17 respectively. The real question is who takes the third spot. Well, the next best player points wise was none other than Fulham’s Ademola Lookman, who scored eight points. Harvey Barnes is unfortunate to miss out, while Marc Albrighton is the second-best right-sided winger out of the selection.
But now let’s get to the focal point of the England attack.
Jamie Vardy is being treated as available since he has not officially retired, while Michail Antonio has recently declared for Jamaica, so will also not be counted.
Striker:
First of all, let’s analyse how many goals our strikers are expected to score.
Expected Goals per 90
| Name | xG90 | Points |
| Jamie Vardy | 0.64 | 5 |
| Dominic Calvert-Lewin | 0.51 | 4 |
| Patrick Bamford | 0.50 | 3 |
| Callum Wilson | 0.47 | 2 |
| Danny Welbeck | 0.42 | 1 |
Jamie Vardy leads the way with 0.64 xG90, while Dominic Calvert-Lewin, Patrick Bamford and Callum Wilson are covered by just 0.04 XG90.
But how clinical are these players?
Goals-expected goals
| Name | G – xG | Points |
| Danny Ings | 2.7 | 5 |
| Dominic Calvert-Lewin | 0.9 | 4 |
| Callum Wilson | 0.1 | 3 |
| Jay Rodriguez | -0.5 | 2 |
| Patrick Bamford | -1.1 | 1 |
The G-xG metric tells us how clinical a player is compared to what they are expected to have scored.
As the table shows, Danny Ings is a far more clinical striker than what he ought to be, outperforming his xG by 2.7, meaning he has scored 2.7 more goals than he would have done were he an average finisher. Calvert-Lewin and Wilson make up the top three before the values dip into negative numbers. With Jay Rodriguez being the best of the profligate finishers.
Shot on target %
| Name | Shots on target % | Points |
| Karlan Grant | 56.3 | 5 |
| Dominic Calver-Lewin | 55.4 | 4 |
| Danny Ings | 45.8 | 3 |
| Ollie Watkins | 44.0 | 2 |
| Patrick Bamford | 39.2 | 1 |
The most important thing a striker can do is get their shots on target, so who is the best at this?
West Brom’s Karlan Grant is the answer to that question, hitting the target with 56.3% of his shots. Calvert-Lewin is the only other player who hits the target more often than not, with the next best after him hitting the target 45.8% of the time.
Shots on target per 90
| Name | Shots on target per 90 | Points |
| DCL | 1.39 | 5 |
| Bamford | 1.26 | 4 |
| Watkins | 1.16 | 3 |
| Ings | 1.03 | 2 |
| Vardy | 0.94 | 1 |
We have looked it at in percentage terms, but what about volume. A striker is asked to score goals, but this often cannot be done without a decent number of shots at the goal first.
Calvert-Lewin once again has his name at the top of the list, getting 1.39 shots on target per 90 minutes. Bamford is the next closest to this with 1.26. Ollie Watkins gets in for the second time, hitting the target 1.16 times per 90. Ings is the final player with a value over 1.00.
Expected assists per 90
| Name | xA90 | Points |
| Vardy | 0.18 | 5 |
| Rhian Brewster | 0.14 | 4 |
| Jay Rodriguez | 0.13 | 3 |
| Bamford | 0.12 | 2 |
| Ings | 0.12 (lower actual assists) | 1 |
While strikers are of course expected to score goals, they are also asked to create for their teammates, so with that in mind what players are the best at this creative role.
Vardy once again gets his name on top spot, with 0.18 xA90. Rhian Brewster makes his first appearance too, with 0.14 xA90, perhaps a sign that the former Liverpool youngster should play more often for this club side.
Overall:
Dominic Calvert-Lewin dominates the strikers, scoring 17 points. While the next three have a three-way tie for second place, with Vardy, Ings and Bamford all scoring 11 points.
However, considering the average position in the tables of the metrics means that Vardy is the one not making the cut of the three strikers.
EURO 2020 ENGLAND TEAM AND SQUAD:
Now we have analysed each position, who is in the squad and who starts at Euro 2020?
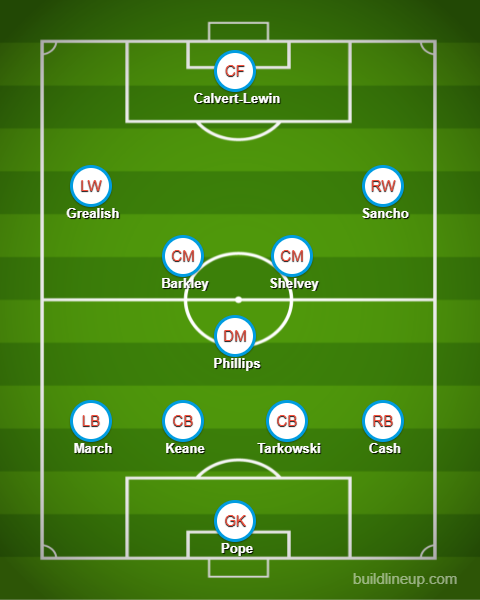
England squad: (26 players; 3 GK’s, 9 Defenders, 11 Midfielder’s, 3 Strikers)
GKs: Nick Pope, Jordan Pickford, Sam Johnstone
Defenders: Solly March, Tyrick Mitchell, Luke Ayling, Matty Cash, James Tarkowski, Michael Keane, Tyrone Mings, Kyle Bartley, Max Kilman
Midfielders: Kalvin Phillips, Declan Rice, Jonjo Shelvey, Ross Barkley, James Maddison, Jack Grealish, Jadon Sancho, Ademola Lookman, Marc Albrighton, James Ward-Prowse, Harvey Barnes
Attackers: Dominic Calvert-Lewin, Danny Ings, Patrick Bamford
For more football content click here.
For more sport content click here.